Debug Log
Typically, a developer can discover and fix most errors by debugging and testing code during development. However, in some cases, errors can occur at runtime causing custom code execution to terminate. When these errors occur, a developer needs to investigate the cause and fix the code accordingly.
Generally, there are three types of runtime errors:
- Coding Errors: Errors in the developer's code, such as
NullPointerException - Vault Errors: Errors in a service call, such as saving a record without setting a required field value
- Governance Errors: Errors thrown by the System when limits are reached, such as elapsed time or size limits
All three types of errors cause:
- Immediate termination of code execution
- Transaction rollback
- Error message to display to end-users, either in Vault or in an API response
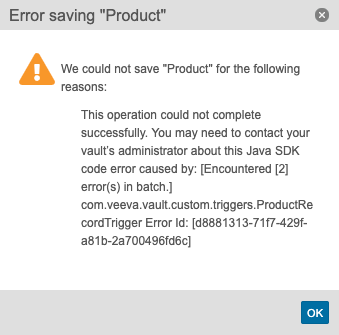
As shown in the message above, Vault directs end-users to an Admin for assistance. The caused by message detail helps developers identify the cause of the error. In some cases, the error message is all a developer needs to fix the error. If a developer needs more information, they can check the Debug Log to further troubleshoot the issue.
Debug Log
Section link for Debug LogFrom the Logs tab in Vault (Admin > Logs > Developer Logs), you can view the Debug Log. The debug log captures custom Vault Java SDK code execution details as well as standard messages from Vault. If enabled by an Admin, the debug log may also include information about Action Triggers
This log is not always on by default. To capture data in the debug log, a Vault Admin must set up a debug log session for a particular user. Every request initiated by a user for which logging is enabled generates a log file. You can apply filters to narrow log entries to only include certain error types (log levels) or classes.
By default, the Vault Owner and System Admin security profiles have permission to view the debug log and set up debug log sessions for a particular user. You can only set up debug log sessions for 20 users per Vault. Learn more about Debug Logs in Vault Help
The log file may contain the following message types:
- DEBUG: Custom messages created with
LogService#debug() - ERROR: Custom messages created with
LogService#error() - WARN: Custom messages created with
LogService#warn() - INFO: Custom messages created with
LogService#info() - SYSERR: Exceptions from Vault Platform, or RollbackExceptions thrown by custom code
- SYSINFO: Informational message from Vault Platform
- SYSWRN: Warning message from Vault Platform
- SYSDATA: SDK execution information from Vault Platform
- PERF: Performance metrics captured with
LogService#logResourceUsage()
The log file captures the following information:
- The start and end of each Vault extension, labelled with
Start ExecutionandEnd Execution. This is particularly helpful to identify nested triggers which fire as a result of other trigger code. - Information about time and size limits, such as the CPU execution time, total elapsed time, and memory. This is helpful to identify issues hitting governance limits.
- The error message shown to the end-user who encountered the error, labelled as
Vault Java SDK Error:. - A stack trace identifying the class and method, including the line number of the error.
- Diagnostic, configuration, and other Vault application messages. Vault application generated messages are prepended with the string
[standard].
For example, a trigger error in the debug log may look like this:
2024-05-08 18:18:05,345 Recordtrigger.com.veeva.vault.custom.CreateRecords SYSDATA {"executionId":"http-VLT-US-EAST-1-PRODUCTION-5-12316004-132-1715192285304","vaultId":123456,"userId":123456,"transactionId":"d8796e64-df16-4642-b6d6-c67e518397f3"}
2024-05-08 18:18:05,345 Recordtrigger.com.veeva.vault.custom.CreateRecords SYSINFO *****Start Execution:[com.veeva.vault.custom.CreateRecords]*****
2024-05-08 18:18:05,348 Recordtrigger.com.veeva.vault.custom.CreateRecords DEBUG Validating input parameters.
2024-05-08 18:18:05,349 Recordtrigger.com.veeva.vault.custom.CreateRecords SYSINFO *****End Execution:[com.veeva.vault.custom.CreateRecords]*****
2024-05-08 18:18:05,349 Recordtrigger.com.veeva.vault.custom.CreateRecords SYSINFO com.veeva.vault.sdk.api.core.LogService#debug(java.lang.String, [Ljava.lang.Object;) - [count=1, elapsed(ms)=1]
2024-05-08 18:18:05,349 Recordtrigger.com.veeva.vault.custom.CreateRecords SYSINFO com.veeva.vault.sdk.api.core.LogService#isDebugEnabled() - [count=1, elapsed(ms)=1]
2024-05-08 18:18:05,399 Recordtrigger.com.veeva.vault.custom.CreateRecords PERF CPU(ns)=151437 elapsed(ms)=1 memory(b)=1008
2024-05-08 18:18:05,403 Recordtrigger.com.veeva.vault.custom.CreateRecords ERROR ErrorId[d8881313-71f7-429f-a81b-2a700496fd6c] java.lang.Throwable: Vault Java SDK Error: [Encountered [2] error(s) in batch.] Error Id: [d8881313-71f7-429f-a81b-2a700496fd6c]
    at ...(Unknown Source)
Caused by: java.lang.Throwable: [Input Position [0] Error [{type='PARAMETER_REQUIRED', subtype='null', message='Missing required parameter [abbreviation__c]'}], Input Position [1] Error [{type='PARAMETER_REQUIRED', subtype='null', message='Missing required parameter [abbreviation__c]'}]]
Service Calls
Section link for Service CallsFor service calls only, the debug log also contains granular information about how long it took each call to execute.
| Parameter | Description |
|---|---|
count | The number of times this method executed. For example, count=3 means this method executed three (3) times. |
elapsed | The amount of time in milliseconds for all counts to complete execution. For example, if count=3, the elapsed time is the amount of time it took all three executions to complete. |
avg | The average amount of time in milliseconds it took each count to complete. For example, if count=3 and elapsed=3ms, it took each count 1ms to complete on average. This value is floored. For example, if the average is 1.9ms per count, this average rounds down to 1ms. If the average time is less than 1ms, this average rounds down to 0ms. |
For example, a call to RecordService in the debug log may look like this:
2017-11-29 05:57:39,995 Recordtrigger.com.veeva.vault.custom.triggers.CreateRecords INFO com.veeva.vault.sdk.api.data.RecordService#newRecord(java.lang.String) - [count=3, elapsed=3ms, avg=1ms]HTTP Callout
Section link for HTTP CalloutIf your Vault extension uses HTTP Callout to make an HTTP request, there is additional information about each request in the debug log.
| Parameter | Description |
|---|---|
HttpRequest | The HTTP method and the URL for this request. |
HttpResponse | The HTTP response code for this request. |
For example, an HTTP request in the debug log may look like this:
2017-11-29 05:57:39,281 Recordtrigger.com.veeva.vault.custom.triggers.CreateRecords INFO HttpRequest:[POST:https://myvault.veevavault.com/api/v18.3/vobjects/product__v]
2017-11-29 05:57:39,313 Recordtrigger.com.veeva.vault.custom.triggers.CreateRecords INFO HttpResponse:[200]
Example Troubleshooting Flow
Section link for Example Troubleshooting Flow- A user encounters an error while using Vault Java SDK.
- A Vault Owner or System Admin sets up a debug log session for a user from Admin > Logs > Debug Logs.
- The user reproduces the issue during the session.
- The debug log captures all necessary information, allowing the Vault Owner or System Admin to determine the source of the issue.
Adding Custom Debug Log Messages
Section link for Adding Custom Debug Log MessagesThe LogService allows developers to send a message directly to the Debug Log to help troubleshoot issues. This is especially helpful when troubleshooting an issue that only occurs at runtime, meaning it's not reproducible in debugging. For example, a developer can write a variable value to the debug log at runtime.
Refer to the Javadocs