Using the Debugger
Instead of running the code, you can place breakpoints and debug the Vault extension class line by line.
- If the debugger is still running, click Stop in IntelliJ® to turn off the debugger.
- Instead of Run, click Debug.
- Add a breakpoint to Line 20.

- In Vault, navigate to the vSDK Hello World object and click Create. You should see the code execution is transferred from the server to your code locally in IntelliJ®.
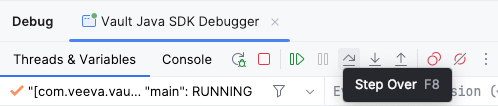
- In IntelliJ®, click the Step Over button from the debug window to move through code execution one line at a time.
- Notice the
eventvariable is assigned a value ofBEFORE_INSERT. The code will now step through theBEFORE_INSERTsection of code logic.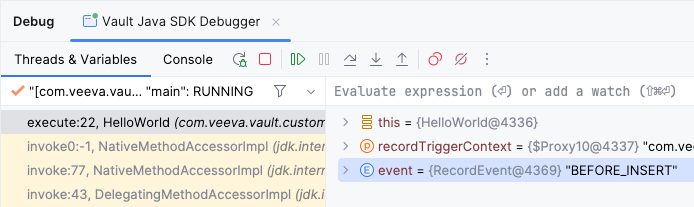
- Click Resume Program.
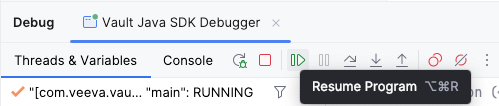
- Code execution will pause at Line 20 again. Click Step Over.
- Notice the
eventvariable is now assigned a value ofAFTER_INSERT. The code will now step through theAFTER_INSERTsection of code logic. - Click Resume Program again to complete code execution.
- Back in Vault, verify that the vSDK Hello World record is created with the description field set to "Hello, {name}!"
- Verify that a vSDK Hello World Child record is created with the same name as the parent record, and that the Hello World field is set to the parent record.
- When you are finished, click Stop to turn off the debugger.