Debugger Setup
In this step, you will:
- Connect your Vault to the Vault Java SDK Debugger
Before deploying code changes, you may want to test it first through the Debugger. Once connected to your Vault, the Debugger allows you to run code locally on your machine without enabling the code for all users in your Vault. This allows you to test and troubleshoot code locally before deploying finished code.
You must have the standard Vault Owner security profile to run the Debugger. Learn more in related permissions.
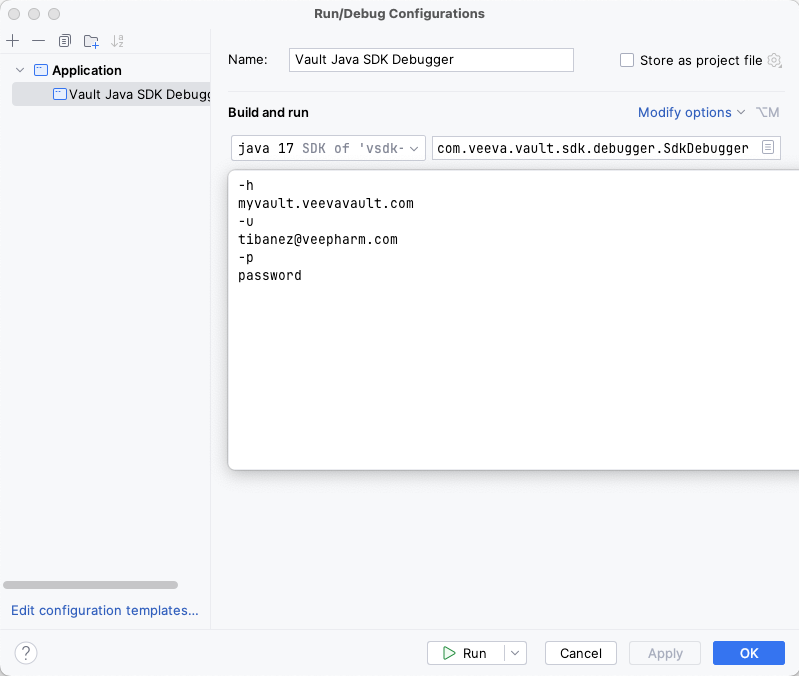
To set up the debugger in IntelliJ:
- Navigate to Run > Edit Configurations....
- Click Add New Configuration and select Application from the drop-down.
- Give your configuration a Name. For example, Vault Java SDK Debugger.
- Add the following data to your new configuration:
Main Class: com.veeva.vault.sdk.debugger.SdkDebugger. The SDK Debugger Main Class should auto-complete as you begin to type. If it does not autocomplete, or if your IDE cannot recognize this Main Class, you may have completed a previous step incorrectly.
Program Arguments:
-h {host name}: The host name of your Vault. For example,myvault.veevavault.com. You should not includehttps://.-u {user name}: Your Vault user name, which you use to log in.-p {password}: Your Vault password.- Optional:
-s {sessionId}: You can choose to authenticate using other tools, such as a browser or PostmanTM, and provide an authenticatedsessionIdin this switch instead of providing-uand-p. - Optional:
-?: Display debugger help and exit.
- Click Apply and then OK.
- Click Run to run the project and attach the debugger to your Vault.
If your connection to the debugger is successful, you will see a console message stating Welcome to the Vault Java SDK Debugger and additional information such as your user, host, and debugger version.
Troubleshooting
Section link for TroubleshootingYou may encounter the following errors when running the debugger:
Your Vault Java SDK library version does not match the Vault version [XX.X.X]. Update your Java SDK library version to match the vault.: Update the<vault.sdk.version>in yourpom.xmlfile to match the Vault version. If the error persists after verifying you’ve completed the steps correctly, you may need to reference our more extensive POM Setup section.Your debugger Java version does not match the vault Java version [17]: Set the IntelliJ® Java SDK version to 17.A Request Profiler session is already in progress for this vault: You must wait for the profiler session to finish before you can attach the debugger. Learn more about the SDK Request Profiler.