SDK Debug Logs
The SDK Debug log contains the execution details and Vault messages for custom Vault Java SDK code at the user level. Vault Admins are responsible for configuring a debug log session, up to one at a time for each user, for up to 20 users. By default, the Vault Owner and System Admin security profiles have permission to view the SDK Debug log and set up sessions for a particular user. Learn more about the SDK Debug log in the Vault Java SDK documentation.
You can use the Vault Toolbox plugin to create a debug log session, retrieve the SDK Debug log, as well as analyze the log itself. Debug logs expire after 30 days. At the end of 30 days, Vault deletes the debug log and all log files.
Creating SDK Debug Log Sessions
Section link for Creating SDK Debug Log SessionsVault Admins can create a new SDK Debug log session for an authenticated particular user via the Vault UI
To create an SDK Debug log session with the Vault Toolbox plugin:
- Within IntelliJ IDEA, open the Vault Toolbox plugin from the righthand sidebar.
- Select the Actions (
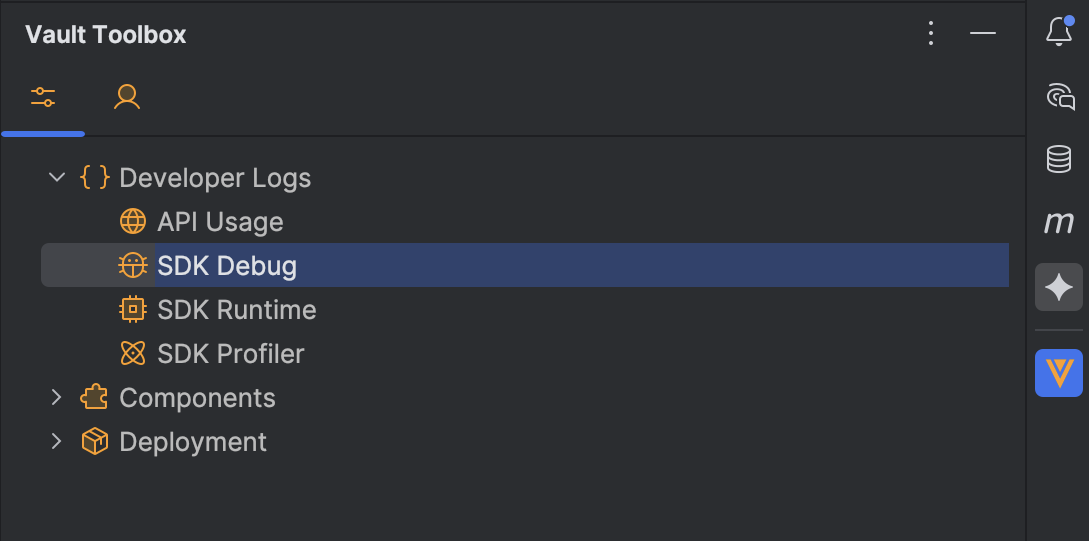
) tab. - Expand Developer Logs (
) and double-click SDK Debug ( ). - In the dialog, click
to create a session. - In the dialog, provide a Name for the session and select the User for which the session should be enabled.
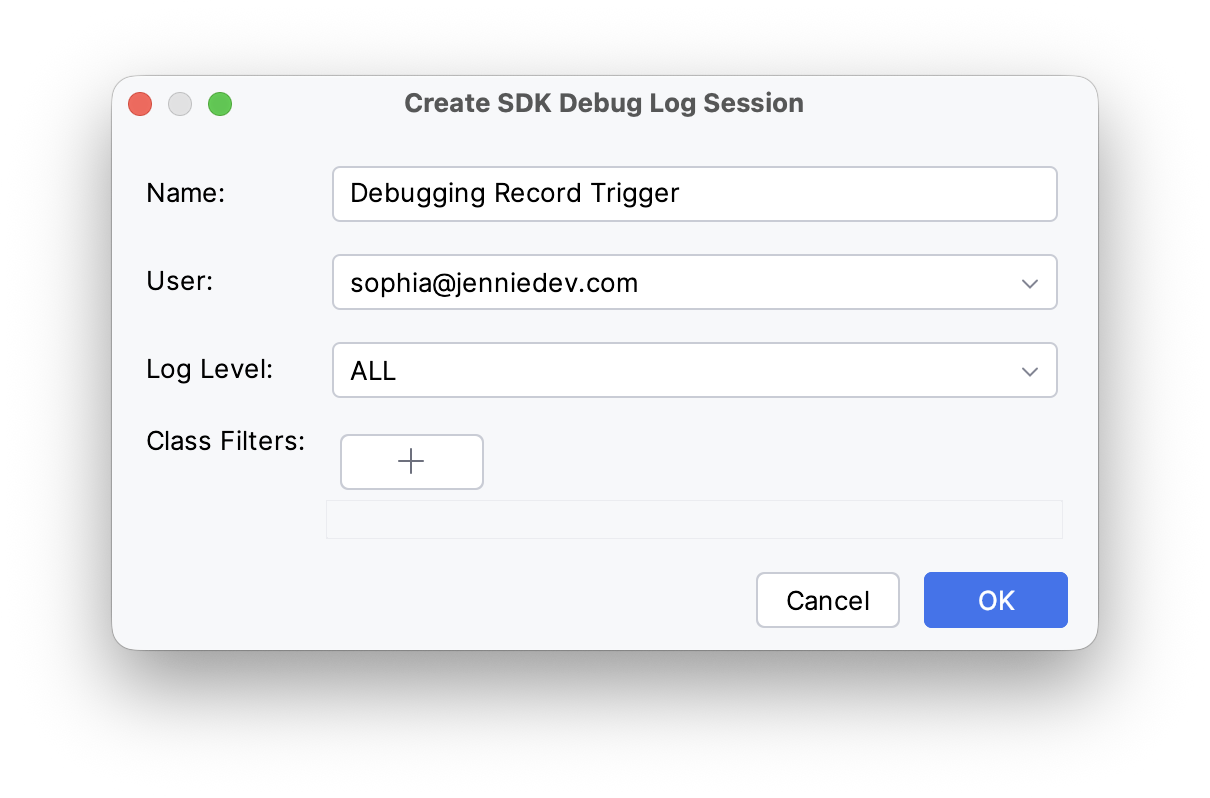
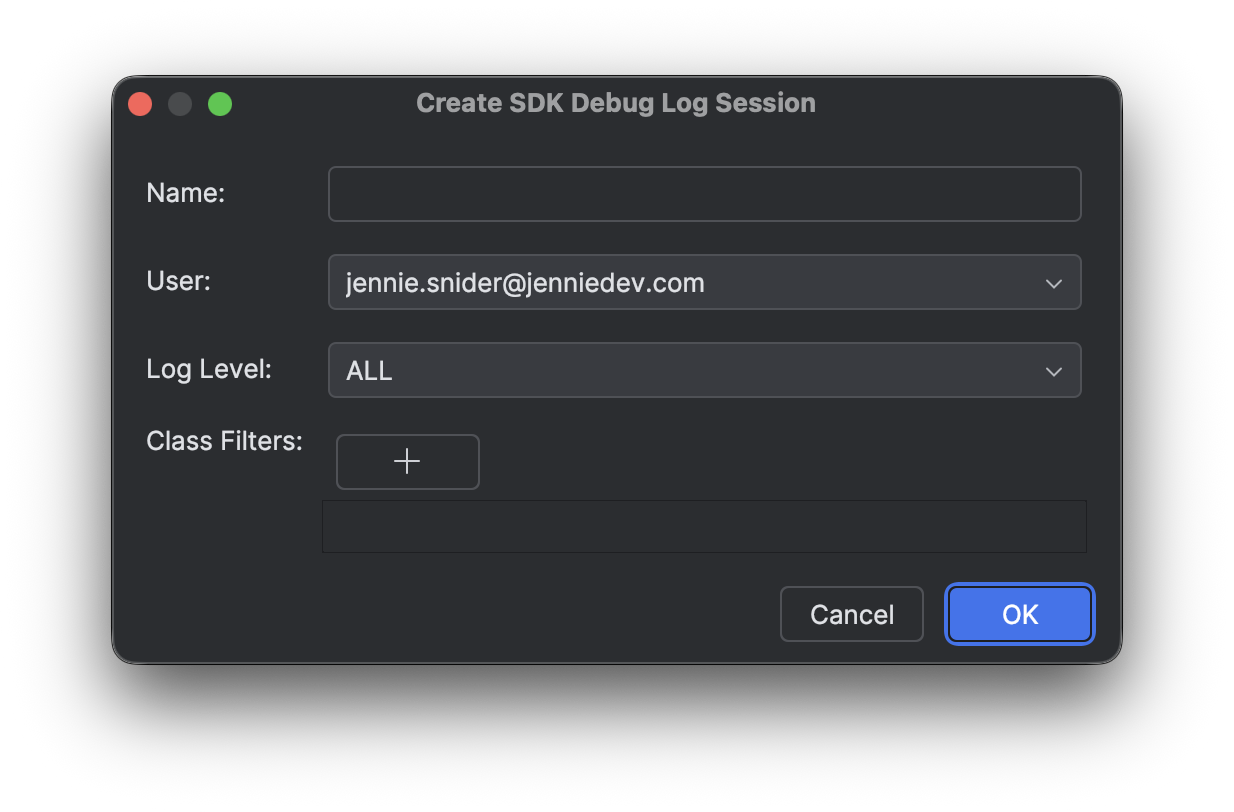
- Optional: Select a Log Level
to narrow the results to only include certain log levels or classes. Click to add Class Filters and select the classes to include. You can include up to 10 classes. - Click OK to create the session.
Downloading SDK Debug Logs
Section link for Downloading SDK Debug LogsTo download SDK Debug logs:
- Within IntelliJ IDEA, open the Vault Toolbox plugin from the righthand sidebar.
- Select the Actions (
) tab. - Expand Developer Logs (
) and double-click SDK Debug ( ). 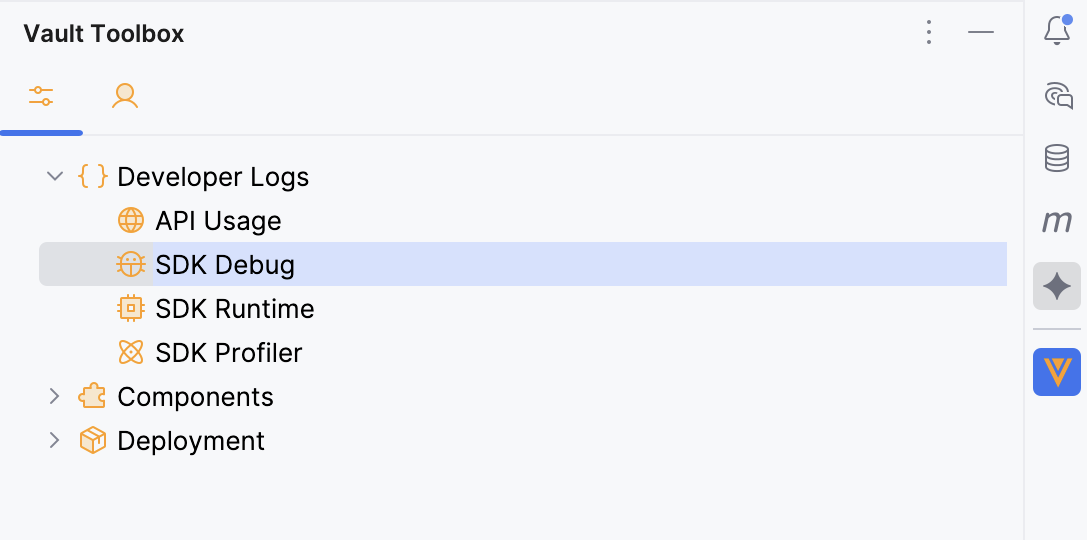
- In the dialog, select the checkbox for one or more debug log session(s) or click Select in the header to select all sessions. If the list is empty, you must create a new debug log session.
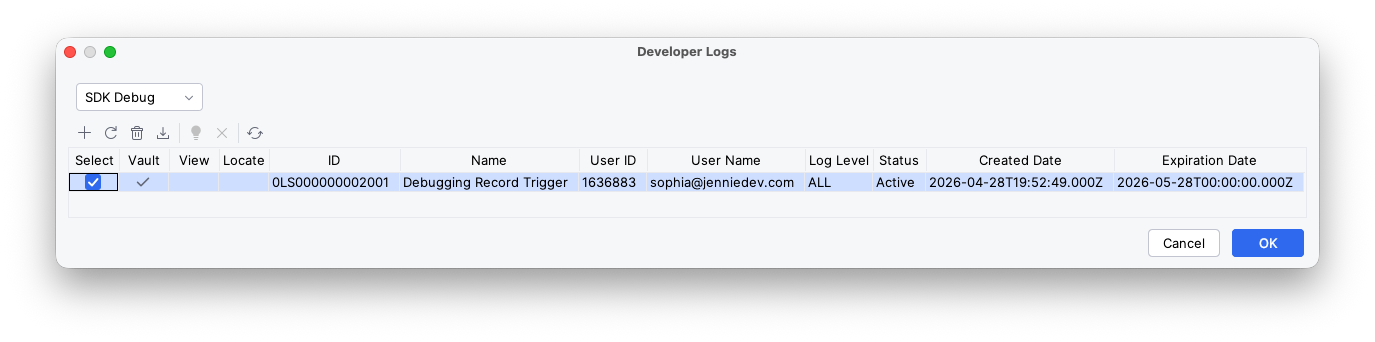
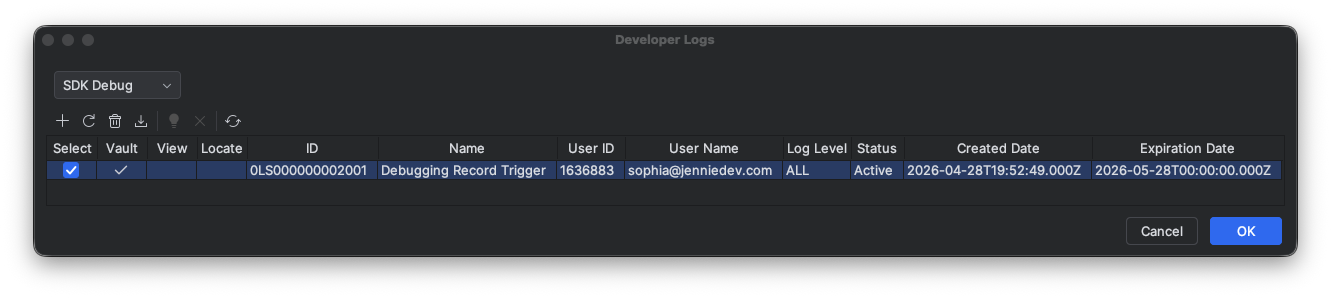
- Optional: Click
to refresh the list of session(s). - Optional: Click
to reset the selected session(s). This action deletes all existing log files for the selected session(s) and resets its Expiration Date to 30 days. - Optional: Click
to delete the selected debug log session(s) from Vault. - Click
or OK to download the selected log(s).
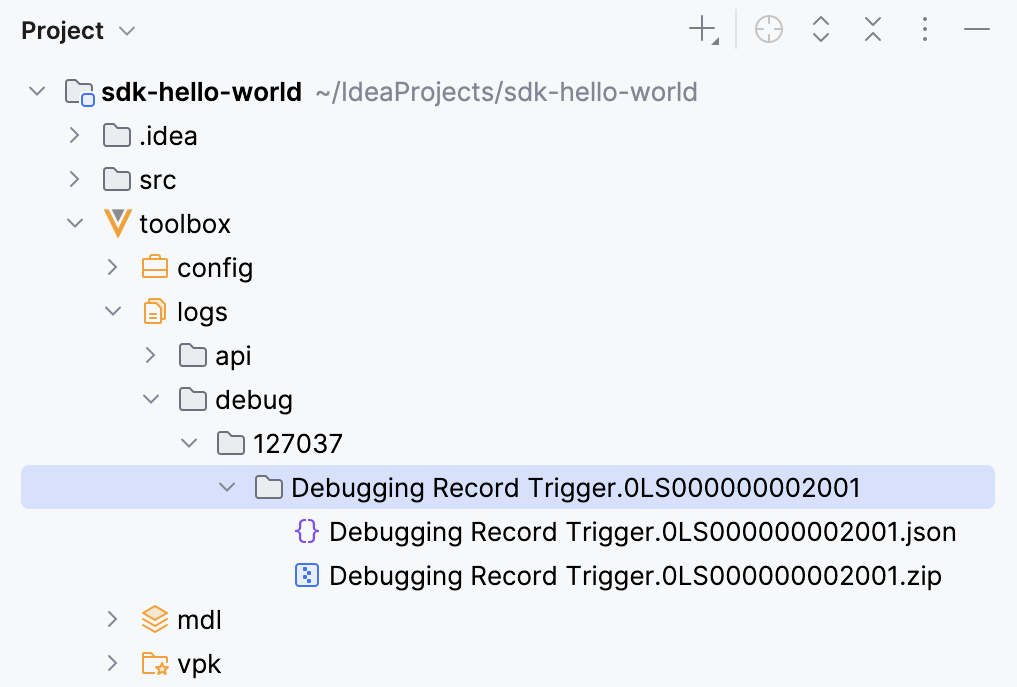
Once the operation is complete, you can access the downloaded SDK Debug log as a .txt file or within the .zip file from the toolbox/logs/debug/{vaultid} folder in your project directory.
Importing SDK Debug Logs
Section link for Importing SDK Debug LogsYou can also load an existing SDK Debug log into the workspace without re-downloading it from Vault. This is useful when you have an archive from a previous Vault Toolbox download, an export from Vault, or a file shared by a colleague.
To import SDK Debug logs:
- Within IntelliJ IDEA, open the Vault Toolbox plugin from the righthand sidebar.
- Select the Actions (
) tab. - Expand Developer Logs (
) and double-click SDK Debug ( ). - In the dialog toolbar, click
to open the file chooser. - Select a Vault log archive (
.zip) or a single log file (.csv,.log, or.txt). Vault Toolbox uses the archive's file name to determine the session folder, so an archive named{vaultid}.{sessionName}.{sessionId}.zip(the same convention used when Vault Toolbox downloads the log) groups the files under the matching session. If the archive name does not include a session ID, the files are placed under animportedsession. - In the Import Log Archive dialog, confirm or update the Vault ID. The plugin auto-fills this field from any leading digits in the file name. Review the preview table to see the destination for each file and whether it will be created as a New file or Overwrite an existing file.
- Click OK to import.
Once the operation is complete, the imported logs are available under toolbox/logs/debug/{vaultid}/{sessionName}.{sessionId} and the table refreshes so you can analyze them.
Analyzing SDK Debug Logs
Section link for Analyzing SDK Debug LogsTo analyze SDK Debug Logs:
- Within IntelliJ IDEA, open the Vault Toolbox plugin from the righthand sidebar.
- Select the Actions (
) tab. - Expand Developer Logs (
) and double-click SDK Debug ( ). - In the dialog, previously downloaded logs are differentiated by a
within the View column. To proceed with analyzing the log(s), select the checkbox for one or more downloaded logs, then click . The CSV file of the analysis will then open in your preferred spreadsheet application. - Optional: To clear local files from your project directory, select the checkbox for one or more downloaded logs, then click
.
Once the operation is complete, you can access the analysis files for the debug logs from toolbox/logs/debug/{vaultid}/analysis in your project directory.