API Usage Logs
The API Usage log contains information such as which Vault API endpoints were called, the user name of the person who sent the request, and remaining burst limits. The API Usage log can help you troubleshoot burst limits and discover which of your integrations are causing you to hit the limit.
You can use the Vault Toolbox plugin to retrieve the API Usage log for a single day, up to 30 days in the past, as well as analyze the log itself. Your user account must have the appropriate permissions to access the API Usage log.
Downloading API Usage Logs
Section link for Downloading API Usage LogsTo download API Usage logs:
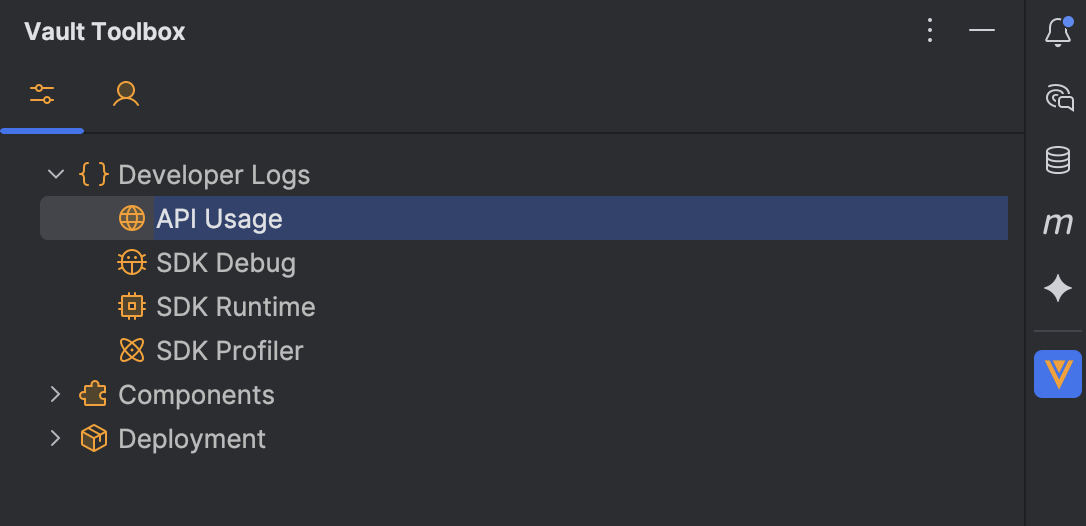
- Within IntelliJ IDEA, open the Vault Toolbox plugin from the righthand sidebar.
- Select the Actions (
) tab. - Expand Developer Logs (
) and double-click API Usage ( ). 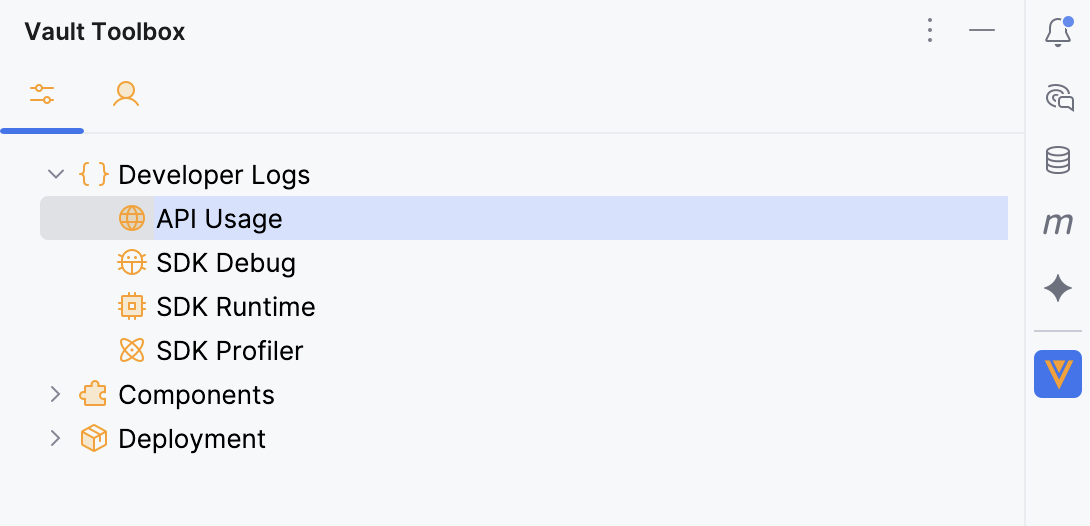
- In the dialog, select the checkbox for the dates you wish to download or click Select in the header to select all dates.
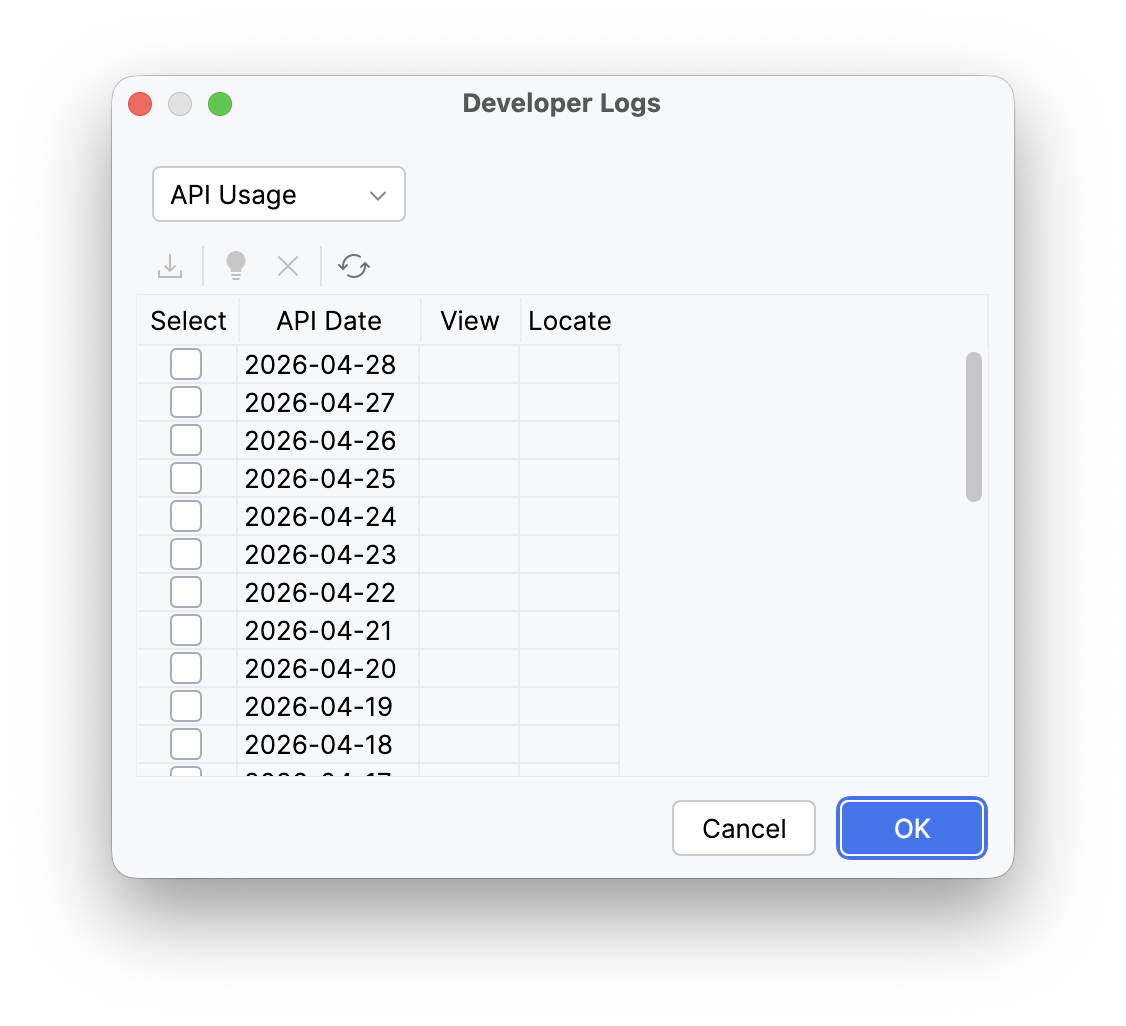
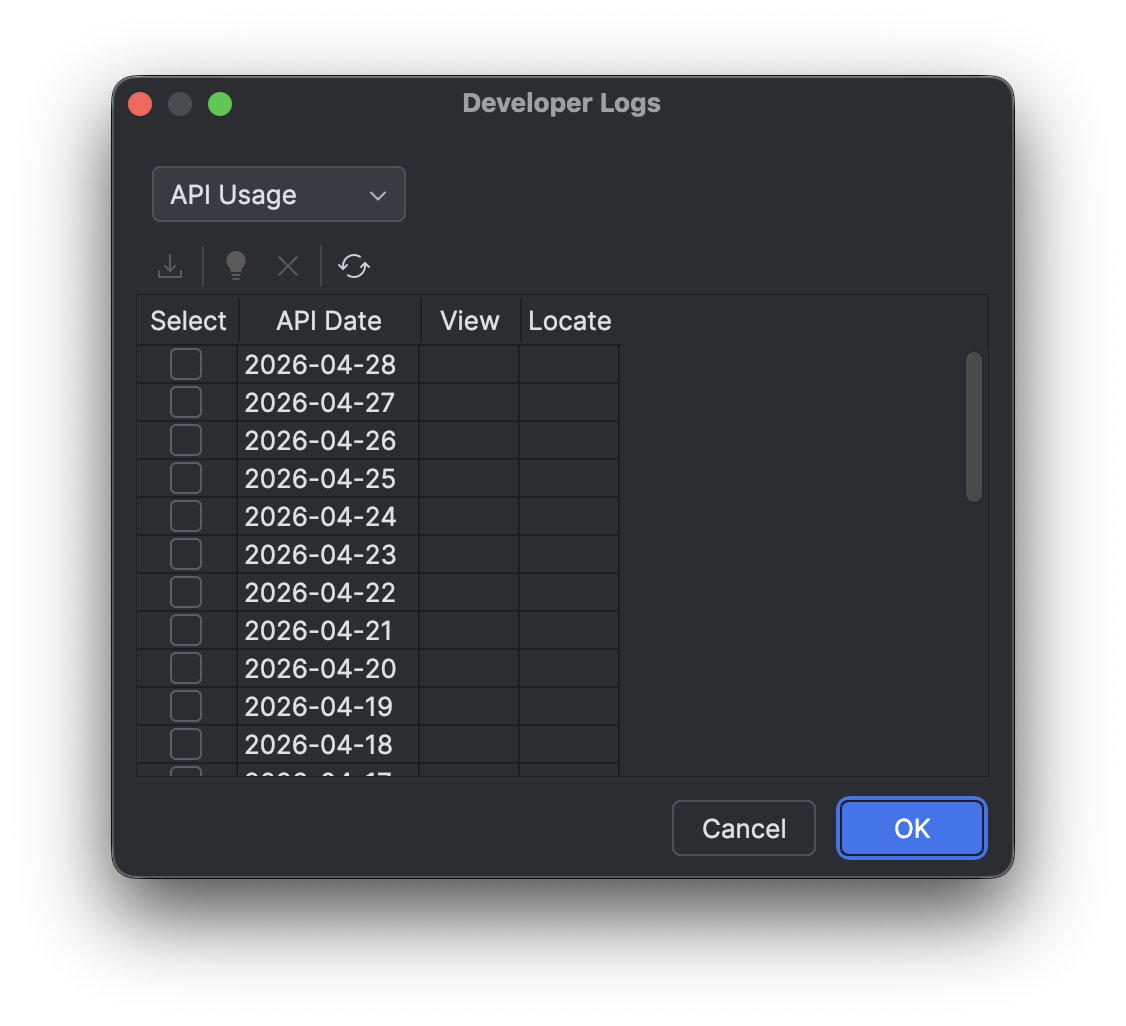
- Optional: Click
to refresh the list. - Click
or OK to download the selected logs. - Optional: After the logs have downloaded successfully, click
within the dialog to open the log in a File Viewer or to locate the folder within your project directory.
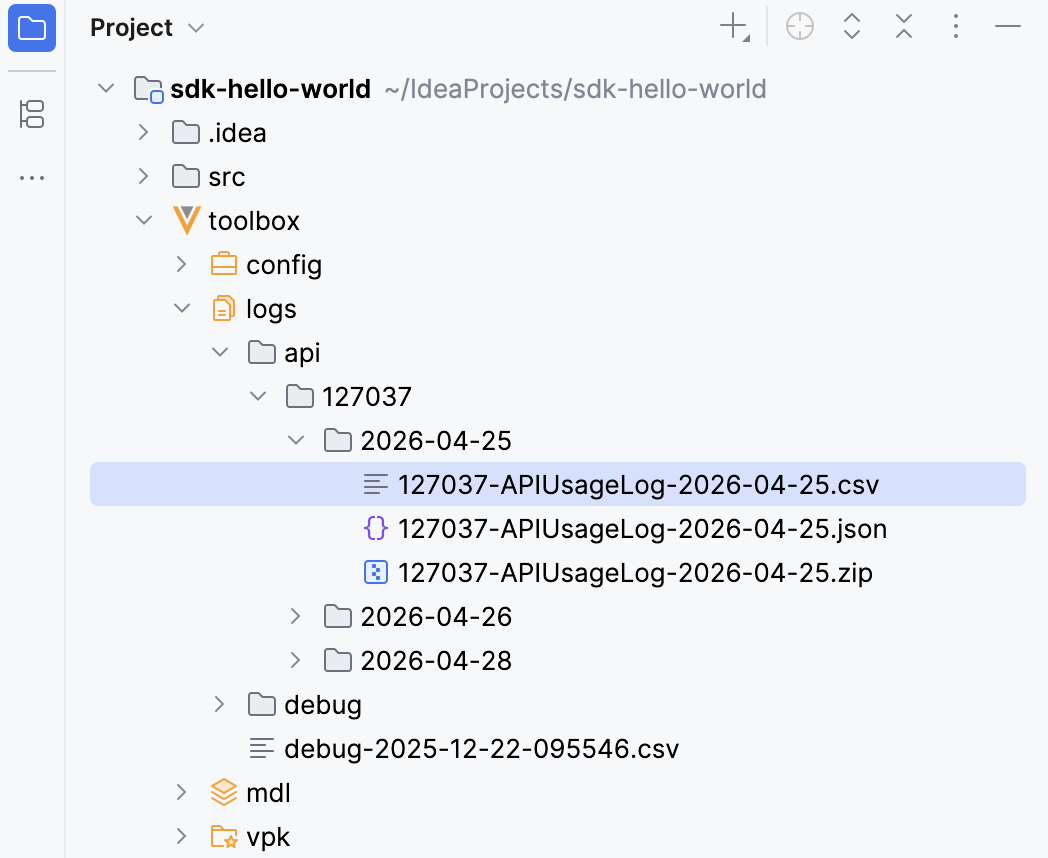
Vault Toolbox generates the API Usage logs for the specified time period. Once the operation is complete, you can access the folders containing the downloaded API Usage logs from toolbox/logs/api/{vaultid} within your project directory. The CSV file prepended with the Vault ID summarizes all API Usage log data for the date indicated. After a log has been downloaded, you can analyze it.
Importing API Usage Logs
Section link for Importing API Usage LogsYou can also load an existing API Usage log into the workspace without re-downloading it from Vault. This is useful when you have an archive from a previous Vault Toolbox download, an export from Vault, or a file shared by a colleague.
To import API Usage logs:
- Within IntelliJ IDEA, open the Vault Toolbox plugin from the righthand sidebar.
- Select the Actions (
) tab. - Expand Developer Logs (
) and double-click API Usage ( ). - In the dialog toolbar, click
to open the file chooser. - Select a Vault log archive (
.zip) or a single log file (.csv,.log, or.txt). Each file in the archive must include a date inYYYY-MM-DDformat in its name, which Vault Toolbox uses to organize the imported files. - In the Import Log Archive dialog, confirm or update the Vault ID. The plugin auto-fills this field from any leading digits in the file name. Review the preview table to see the destination for each file and whether it will be created as a New file or Overwrite an existing file.
- Click OK to import.
Once the operation is complete, the imported logs are available under toolbox/logs/api/{vaultid}/{date} and the table refreshes so you can analyze them.
Analyzing API Usage Logs
Section link for Analyzing API Usage LogsYou can use the Vault Toolbox plugin to analyze API Usage logs after they have been downloaded. The resulting CSV file contains information about each API call made on the indicated date, such as the endpoint name, response status, and error messages.
To analyze API Usage logs:
- Within IntelliJ IDEA, open the Vault Toolbox plugin from the righthand sidebar.
- Select the Actions (
) tab. - Expand Developer Logs (
) and double-click API Usage ( ). - In the dialog, previously downloaded logs are differentiated by a
within the View column. To proceed with analyzing the log(s), select the checkbox for one or more downloaded logs, then click . The CSV file of the analysis will then open in your preferred spreadsheet application. - Optional: To clear local files from your project directory, select the checkbox for one or more downloaded logs, then click
.
Once the operation is complete, you can access the analysis files for the API Usage logs from toolbox/logs/api/{vaultid}/analysis in your project directory. The CSV file appended with the date contains an analysis of all API Usage log data for that respective date.